What Kind of Test Reports Does TestSprite Provide?
 Zeshi Du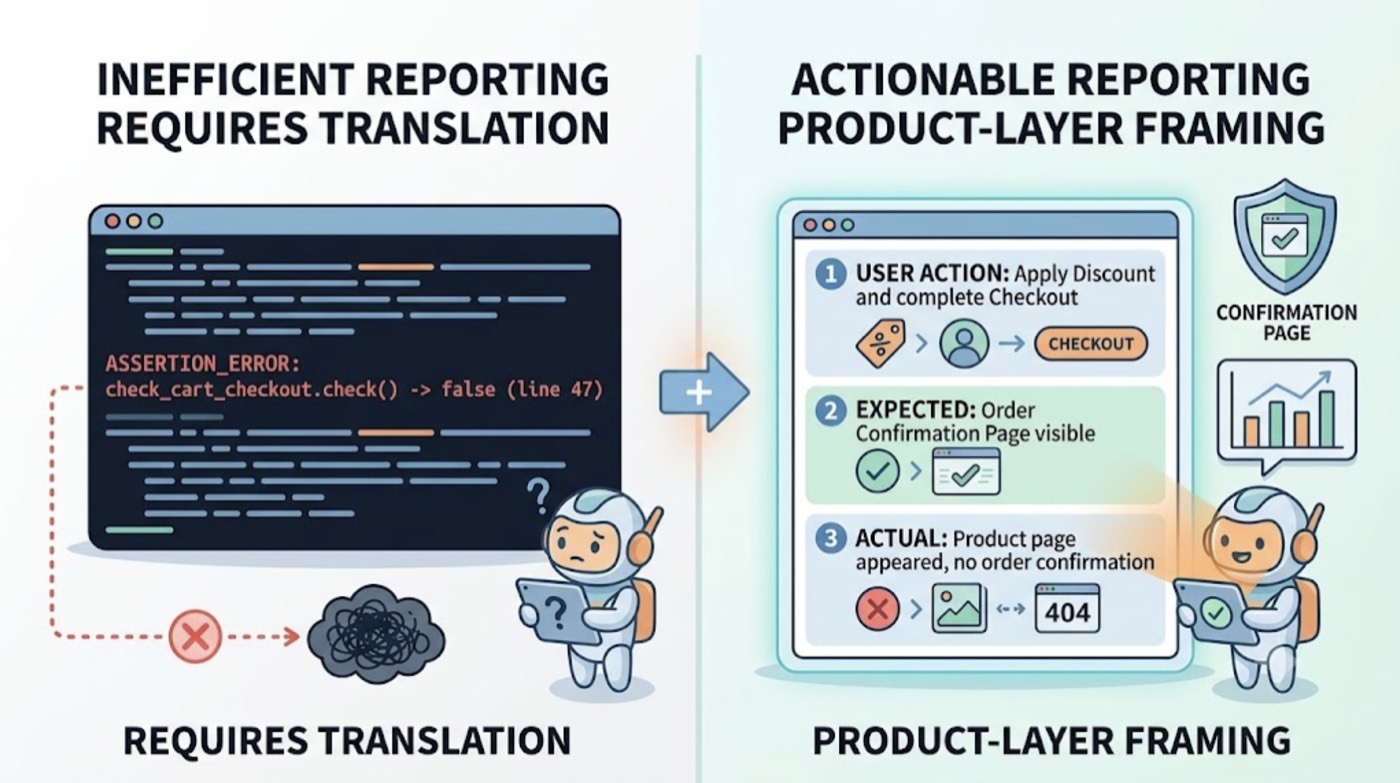
The value of a test report is in what you can do with it after reading it.
A report that tells you "assertion X evaluated to false at line 47" requires investigation before it tells you anything useful. A report that tells you "the user tried to complete checkout after applying a discount code and the order confirmation page did not appear" tells you what to fix.
TestSprite's reports are built for the second model. Every result is described in product-layer terms: what user action was taken, what the product was supposed to deliver, and what actually happened. That framing makes reports actionable without requiring the developer to translate test output into a product problem.
The In-IDE Report: Structured Failure for the Coding Agent
When a TestSprite session runs through the TestSprite MCP Server inside Cursor, Claude Code, Windsurf, or VS Code, the results return to the IDE's chat interface.
Other verification tools read your code and guess. TestSprite opens your app and uses it.
Because the agents were navigating the live application and observing real product behavior, the failure reports describe real product behavior. Not function return values. Not assertion mismatches. The user action that was taken, the expected product outcome, and the actual outcome.
This format is specifically designed for the AI coding agent in the IDE. When Claude Code or Cursor receives a failure description that says "the agent navigated to the billing section, initiated a plan upgrade, and the account settings page continued to show the free tier plan after the upgrade confirmed," the coding agent has enough context to locate the issue and propose a fix in the same session.
That's the report that closes the loop. Not the report the developer has to read and then act on. The report the coding agent acts on directly.
The Web Portal Dashboard: Quality Trends Over Time
The TestSprite Web Portal provides the persistent view of test history across sessions, projects, and team members.
Each test run is logged with its full result set: which flows were tested, which passed, which failed, and what the failure descriptions contained. The run history lets teams compare results across sessions and track quality trends over time.
The "Changes vs previous" column in scheduled runs shows at a glance which tests changed status between the current run and the last one. A test that was passing for two weeks and suddenly failed is immediately distinguishable from a test that's been consistently green. This distinction matters for investigation triage: the sudden failure is the one worth looking at.
For teams managing multiple projects, the Web Portal provides a consolidated view across all of them. Quality trends, run history, and test plan management are available per project and in aggregate.
The PR Comment: Coverage Alongside the Diff
When tests run through the GitHub Actions integration on a pull request, results post back as PR comments before the review starts.
The reviewer sees test coverage alongside the diff. Not in a separate tool. In the same pull request where the code change lives.
The PR comment shows which flows were tested, which passed, and which failed. Failure descriptions use the same product-layer framing: what was navigated, what was expected, what actually happened. The reviewer can read the failure description and understand what broke without investigating independently.
For AI-native teams where pull requests often contain the output of a Claude Code or Cursor session, this means every PR has product-layer coverage before anyone approves it. The diff shows what changed in the code. The TestSprite comment shows whether what changed in the code broke anything for users.
The Failure Email: Morning Summary Without the Dashboard
For scheduled regressions, TestSprite sends failure emails that include an AI-authored explanation of the cause for each failed test, inline.
The engineer who checks email in the morning doesn't have to log into a dashboard to understand what broke. The email contains the failure description and the likely cause. If the nightly run surfaced three failures, the email tells you what broke in each, so you can triage before you've opened a laptop.
This is part of Smarter Schedules: the reporting layer designed for unattended runs where nobody is watching the dashboard in real time. The "Changes vs previous" column in the Web Portal and the inline cause explanation in the failure email together give the morning review enough context to determine what needs attention and what doesn't.
Backend Test Reports: Specific and Observable
For backend API tests generated through Backend Testing 2.0, the failure reports have a specific structure.
When an API contract breaks, the report identifies which endpoint, which field changed, what the prior observed response contained, and what the current response contains. The failure is specific: not "the test failed" but "the endpoint previously returned userId and now returns txId, and these downstream test steps were passing the old field name."
For CRUD lifecycle failures, the report shows which step in the sequence failed and what the sequence had captured from previous steps. If a create call returns an ID in an unexpected format and the downstream update call fails because of it, the report connects the two: here is the ID the create step captured, here is the format the update step expected, here is what actually arrived.
That specificity means the developer who reads the report knows exactly where to look. No tracing through logs. No reconstructing the sequence manually.
When a test can't run because a credential expired or a dependency was unavailable, the Blocked status appears with a plain-English explanation rather than a misleading red failure. The morning review can distinguish "the product broke" from "the test environment had an issue" without investigation.
A Scenario: One Failure Description That Fixed the Bug
A developer uses Cursor to update their application's user profile section. The session changes how the display name is stored and retrieved. Before pushing, they trigger TestSprite from inside Cursor.
The agents navigate the user profile section as a real user updating their account would. They update the display name, save the changes, and navigate to the account overview page to verify the change is reflected there.
The failure report arrives in the Cursor chat:
The agent navigated to the user profile settings. The display name field was updated to "Alex Rivera." The save action completed with a success message. The agent then navigated to the account overview page. The account overview displayed the previous display name "Alex" rather than the updated "Alex Rivera."
The product correctly saved the display name in the profile settings. The account overview reads from a different cached value that wasn't updated when the profile save occurred.
The Cursor coding agent receives this description. It identifies the cache that the account overview reads from, locates where the profile save handler should invalidate it, and proposes the fix in the same session. The developer applies it and runs TestSprite again to confirm.
One failure description. Enough context to fix the bug without investigation. The report did its job.
Conclusion
TestSprite's test reports come in four forms: the in-IDE structured failure description for immediate action by the coding agent, the Web Portal dashboard for quality trends and run history, the PR comment for review-time coverage alongside the diff, and the failure email for overnight regression triage.
All of them share the same underlying format: product-layer descriptions of what user action was taken, what the product should have delivered, and what actually happened. That framing is what makes the reports actionable, whether the reader is a coding agent in an IDE session or a developer checking email before the morning standup.
Start generating actionable test reports with TestSprite from inside your AI IDE today.