Can AI Test Dashboard Visual States?
 Zeshi Du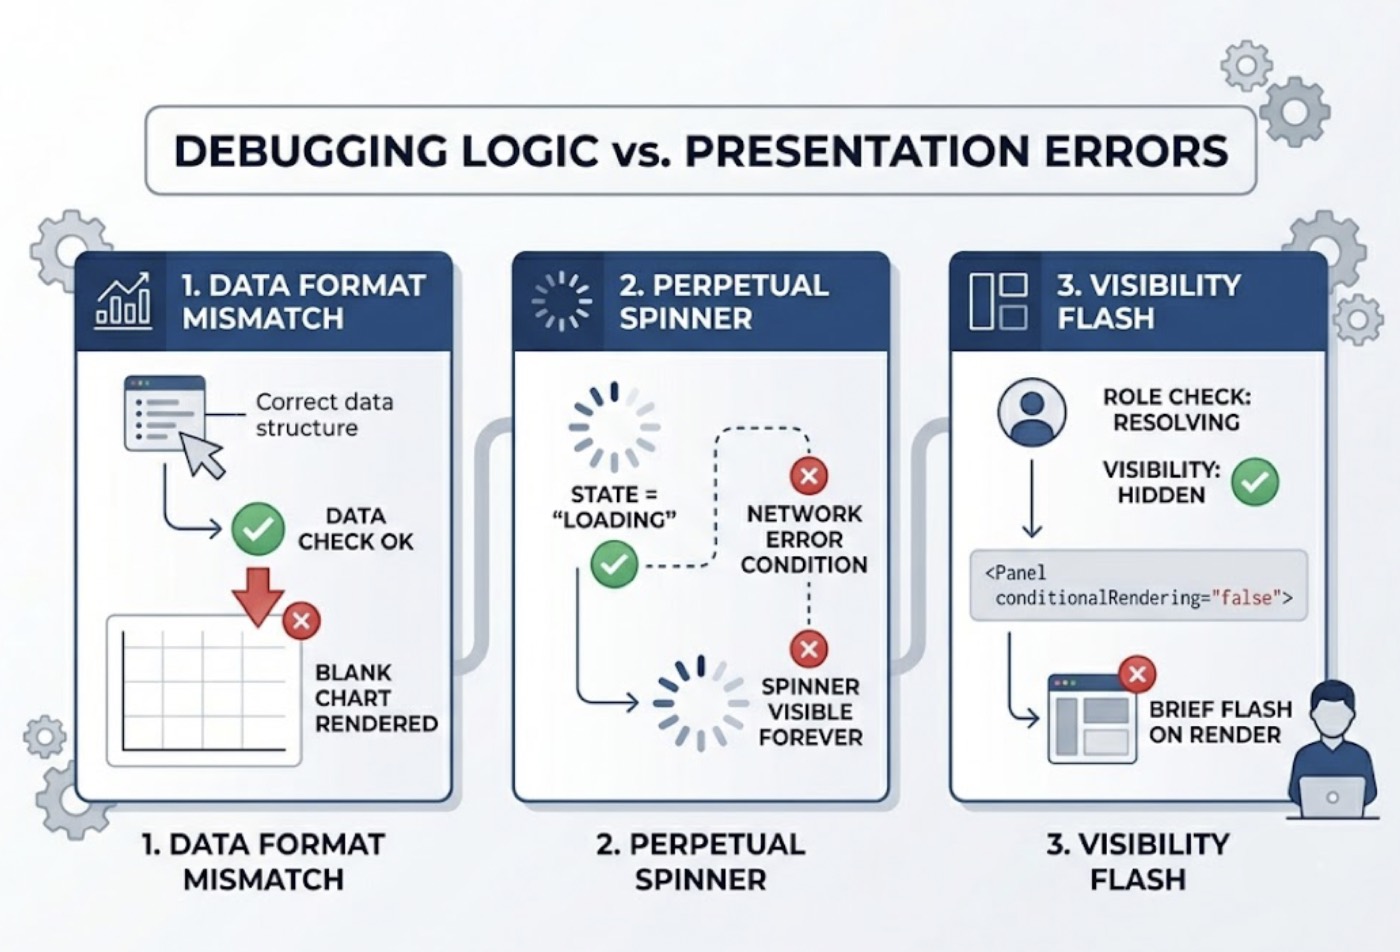
Dashboards are one of the most testing-resistant surfaces in a web application.
Not because they're technically complex, though many are. Because their correctness is fundamentally visual and contextual. A dashboard that renders without errors can still show the wrong data, display a loading state that never resolves, collapse a chart when the window resizes, or show an empty state when data is present. None of these failures throw an exception. None of them produce a stack trace. They just look wrong to anyone who uses the product.
Code-layer testing can't see that. An assertion that a component rendered, that an API call returned data, that a state variable updated correctly tells you nothing about whether the dashboard looks right and behaves correctly for a real user in a real browser session. That gap is where dashboard visual state bugs live.
What "Visual State" Actually Means for Dashboards
A dashboard visual state is the specific combination of UI conditions that a user sees at any given moment. It's not just "the dashboard rendered." It's which panels are visible, whether the data is loaded or loading, whether filters are applied, whether the selected time range is reflected in the charts, whether role-based panels appear for the right users and are hidden for others.
Each of these conditions is a visual state. And dashboards typically have many.
An empty state when no data exists yet. A loading state while data is being fetched. An error state when a data source is unavailable. A filtered state when the user has narrowed the view. A role-restricted state when certain panels are only visible to admin users. A responsive state when the viewport narrows and the layout reflows. A real-time state when live data is streaming in and charts are updating.
Testing dashboard visual states means verifying that each of these conditions produces the right visual outcome, that transitions between states are handled correctly, and that no state combination produces a broken or misleading display.
That's a lot of states. And the only way to verify them is to create the conditions and observe what the dashboard actually shows.
Why Code-Layer Tools Can't Test What Dashboards Actually Show
A code-layer tool approaches a dashboard by reading its component tree. It finds the chart components, the filter components, the data-fetching logic. It generates assertions that confirm those components receive the right props, that the data-fetching function is called with the right parameters, that the state variable tracking the selected time range updates when a filter is applied.
These assertions confirm that the dashboard's logic is implemented correctly. They don't confirm what the dashboard actually shows.
A chart component that receives correct data can still render blank if the data format doesn't match what the charting library expects. A loading spinner that's correctly tied to a state variable can still stay visible forever if the variable never transitions to the loaded state under certain network conditions. A panel that's correctly hidden in the component's conditional rendering logic can still flash briefly on initial render before the role check resolves.
None of these show up in a code-layer assertion. All of them show up when a real user looks at the dashboard.
Testing visual states requires observing the dashboard. Not reading the code that describes it.
How TestSprite Observes Dashboard Visual States
TestSprite tests dashboard visual states by visiting the live application and interacting with it the way a real user does.
Other verification tools read your code and guess. TestSprite opens your app and uses it.
A fleet of parallel exploration agents navigates to the dashboard and observes its initial state. They check what's visible, what's loading, what's absent. They interact with filters and observe how the visual state responds: do the charts update, do the active filter indicators appear, does the time range selection change what's displayed? They resize context where relevant and observe whether the responsive layout reflows correctly or collapses in ways that obscure data.
For role-based dashboards, the agents operate under different authentication contexts. An admin-role agent navigates the dashboard and observes which panels are present. A viewer-role agent navigates the same dashboard and observes which panels are correctly absent. If a panel that should be restricted to admins is visible to viewers, that's a visual state failure. If a panel that should always be present is missing for a specific role, that's also a visual state failure.
This is the testing behavior of a QA engineer doing a first walkthrough of a new dashboard feature. They don't inspect the component tree. They look at the dashboard under different conditions, switch roles, apply filters, wait for data to load, and note when something looks wrong.
State Transitions Are as Important as States Themselves
A dashboard can render each individual state correctly and still fail at the transitions between them.
The loading state displays correctly. The loaded state displays correctly. But the transition from loading to loaded produces a layout shift that pushes the filter panel out of the visible viewport. The user has to scroll to reach the filters they were using before the data finished loading.
The empty state displays correctly. The moment data appears, the empty state panel should disappear and the populated dashboard should take its place. Instead, both states render simultaneously for a brief moment before the empty state is dismissed.
The filtered state displays correctly for a single filter. When two filters are applied simultaneously, the dashboard enters a visual state where one filter's indicator appears but the other's doesn't, even though both are active.
These are transition bugs. They only appear when an agent creates the right conditions and observes what happens during and immediately after the state change, not just what the final state looks like.
TestSprite's exploration agents don't snapshot states in isolation. They create conditions, observe what changes, and verify that the product visually handles the journey between states correctly. When a filter is applied, the agent observes the full sequence: loading indicator appears, data updates, loading indicator disappears, filter indicator appears in the active state. Any gap in that sequence is a visual state failure.
Data-Dependent Visual States Need Real Data
Many of the most important dashboard visual states only appear under specific data conditions. An empty state that only renders when a specific query returns zero results. A warning state that only appears when a metric crosses a threshold. A comparison view that only activates when the user selects two time periods simultaneously.
Testing these states from code inspection requires mocking the right data conditions, which requires knowing in advance what conditions to mock, which requires the kind of exploratory knowledge that code inspection doesn't provide.
TestSprite's Backend Testing 2.0 covers the data layer the same way it covers the UI layer: by observing real behavior before making assertions. Before generating any test plan for a dashboard that depends on API data, the agent calls the data endpoints and observes what they actually return. Real response shapes. Real field names. Real empty states, error responses, and partial data conditions.
When a dashboard visual state depends on an API returning an empty array, the agent creates the condition in the real environment, observes the dashboard's response, and verifies that the empty state renders as expected. When the API returns a partial response because one data source is unavailable, the agent observes how the dashboard handles the degraded data and verifies that the visual state is informative rather than broken.
Dynamic variables captured from real responses flow automatically through multi-step data scenarios. A dashboard test that requires creating data, navigating to the dashboard, and verifying that the created data appears passes real resource IDs from the creation step to the verification step.
Keeping Visual State Coverage Current After AI Coding Changes
Dashboards change frequently. New panels get added. Filters get updated. Role-based visibility rules get adjusted. Chart types get swapped. AI coding sessions in Cursor or Claude Code can touch multiple dashboard components in a single session.
Each of those changes is a potential visual state regression. A new panel that was added without updating the responsive layout rules might render correctly at full width and overlap other elements at narrower viewports. A filter update that worked correctly for single selections might produce an undefined visual state when multiple filters are combined.
TestSprite's Auto-Heal Rerun handles the maintenance layer. When a dashboard update causes a test to fail, the agent determines whether the failure reflects a genuine visual state regression or a layout change that doesn't affect the underlying behavior. A repositioned filter panel, a restyled chart header, a redesigned role indicator: the test adapts rather than failing falsely.
Through the TestSprite MCP Server inside Claude Code, Cursor, or Windsurf, the full visual state testing pipeline runs from a single instruction. Through the GitHub Actions integration, visual state coverage runs on every pull request. Changes that introduce visual state regressions surface in CI before they reach users.
Auto-Auth handles the authentication layer for role-based visual state tests. Admin and viewer role contexts are maintained automatically across all runs. Scheduled regressions test every relevant role with fresh credentials.
Conclusion
AI can test dashboard visual states, but only if it's testing the dashboard the way a real user sees it, not the way the source code describes it.
Code-layer tools confirm that dashboard components receive correct data. They can't confirm whether the dashboard looks right under the conditions real users encounter: different roles, different data states, different filter combinations, different viewport sizes, and the transitions between all of them.
TestSprite observes dashboard visual states by navigating the live application under real conditions. Its exploration agents apply filters and observe the response. They operate under different role contexts and verify that visibility rules produce the right visual outcomes. They create data conditions and check that the dashboard handles them correctly. They observe state transitions, not just individual states.
For AI-native teams where dashboard logic evolves alongside frequent AI coding changes, visual state coverage that runs automatically and stays current is the difference between catching a broken dashboard before it ships and finding out from a user who can't read their data.
Start testing your dashboard visual states with TestSprite from inside your AI IDE today.